16.40. lvis2kml
A simple tool for use with LVIS (Land, Vegetation, and Ice Sensor) lidar data from the NASA IceBridge program. Generates a Google Earth compatible .kml files from either an LVIS data file (.TXT extension) or an LVIS boundary file (.xml extension). Using this tool makes it easy to visualize what region a given LVIS file covers and what the shape of its data looks like. If the output path is not passed to the tool it will generate an output path by appending “.kml” to the input path. This tool requires the simplekml Python package to run. One way to get this is to install the ASP Python tools, described in Section 16.69.
Usage:
> lvis2kml [options] <input path> [output path]
Command-line options for lvis2kml:
- -h, --help
Display this help message.
- --name <string>
Assign a name to the KML file.
- --color <red|green|blue>
Draw plots in the named color.
- --skip <int (default: 1)>
When loading a data file, plot only every N-th point. Has no effect on boundary files.
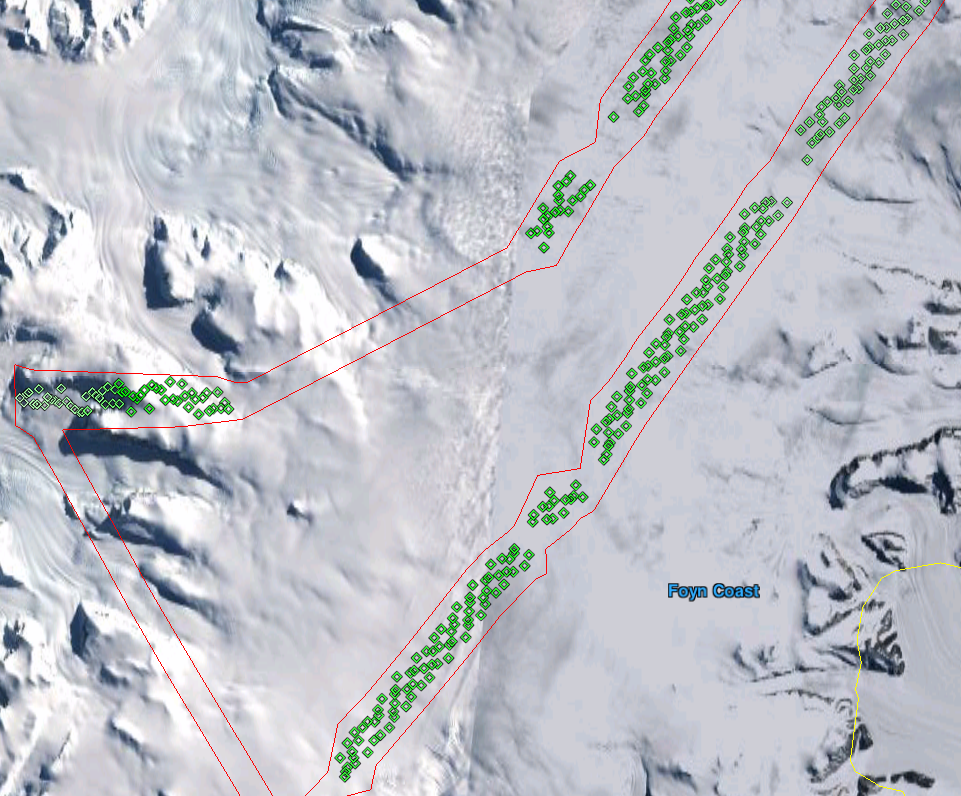
Fig. 16.22 Example of KML visualizations produced with lvis2kml. The output
from both the boundary file (red) and the data file (green) with a
point skip of 500 are shown in this image. The color saturation of
data points is scaled with the elevation such that the points in the
file with the least elevation show up as white and the highest points
show up as the specified color.