16.14. colormap
The colormap tool reads a DEM or some other single-channel image,
and writes a corresponding color-coded image that can be used
for visualization.
Usage:
colormap [options] <input DEM>
Example:
colormap --min -5 --max 10 image.tif
This will produce image_CMAP.tif, with the “hottest” color
corresponding to pixel values at least 10, and the “coolest” color
representing pixel values less than or equal to -5.
To create a hillshaded (Section 16.28) colormap of a DEM, run:
colormap --hillshade -e 25 -a 300 dem.tif -o color-shaded.tif
Alternatively, run:
hillshade -e 25 -a 300 dem.tif -o shaded.tif
colormap dem.tif -s shaded.tif -o color-shaded.tif
The second approach can incorporate any type of grayscale image as a multiplier to the colorized image.
See Section 6.3 for a discussion of ASP’s visualization tools, including this one.
To add a colorbar and axes, use stereo_gui (Section 16.72.5).
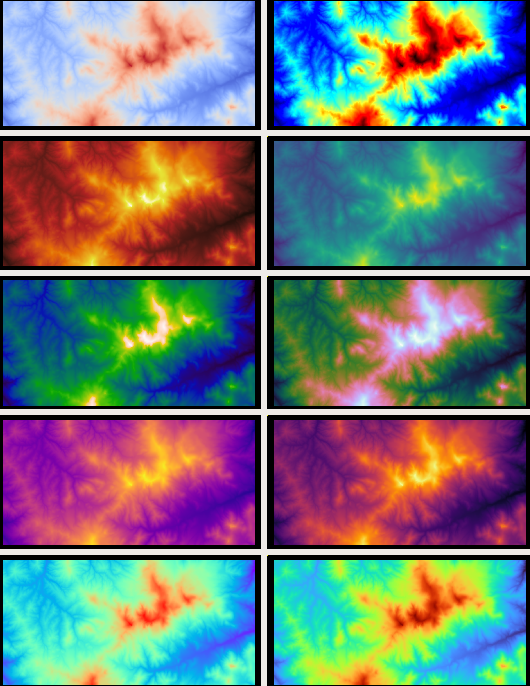
Fig. 16.2 Example of images produced with the following colormaps (left to
right, and top-down): binary-red-blue (default),
jet, black-body, viridis, kindlmann,
cubehelix, plasma, inferno, rainbow, turbo
(source1, source2).
16.14.1. Using your own colormap
Both this tool and stereo_gui (Section 16.72) accept a
user-defined colormap. It should be in a file named, for example,
mycolormap, and can be passed to these tools via --colormap-style
mycolormap. Such a file must be in plain text, with four columns
having on each row a floating point number (increasing from 0 to 1),
then 3 integers between 0 and 255, corresponding to the RGB components
of a color.
Here’s an example Python code which creates a custom colormap, by exporting it from a matplotlib colormap:
#!/usr/bin/python

from matplotlib import cm

# colormap name goes here, e.g., 'turbo'
cmap = cm.turbo
num = cmap.N
for i in range(num):
   rgba = cmap(i)
   print(i / float(num - 1),
         round(255 * rgba[0]),
         round(255 * rgba[1]),
         round(255 * rgba[2]))
Save this script as export_colormap.py, and run it as:
python ~/bin/export_colormap.py > mycolormap
16.14.2. Command-line options for colormap
- -o, --output-file <filename>
Specify the output file.
- --colormap-style <string (default=”binary-red-blue”)>
Specify the colormap style. Options:
binary-red-blue(default),jet,black-body,viridis,kindlmann,cubehelix,plasma,inferno,rainbow,turbo. Or specify the name of a file having the colormap, on each line of which there must be a normalized or percentage intensity and the three integer RGB values it maps to.- --nodata-value <arg>
Remap the DEM default value to the min altitude value.
- --min <arg>
Minimum height of the color map.
- --max <arg>
Maximum height of the color map.
- --moon
Set the min and max height to good values for the Moon.
- --mars
Set the min and max height to good values for Mars.
- -s, --shaded-relief-file <filename>
Specify a shaded relief image (grayscale) to apply to the colorized image. For example, this can be a hillshaded image.
- --hillshade
Create a hillshaded image first, then incorporate it in the colormap. This is equivalent to using an external file with the
--shaded-relief-fileoption.- -a, --azimuth <number-in-degrees (default: 300)>
Sets the direction that the light source is coming from (in degrees). Zero degrees is to the right, with positive degrees counter-clockwise. To be used with the
--hillshadeoption.- -e, --elevation <number-in-degrees (default: 20)>
Set the elevation of the light source (in degrees). To be used with the
--hillshadeoption.- --legend
Generate an unlabeled legend, will be saved as
legend.png.- --threads <integer (default: 0)>
Select the number of threads to use for each process. If 0, use the value in ~/.vwrc.
- --cache-size-mb <integer (default = 1024)>
Set the system cache size, in MB.
- --tile-size <integer (default: 256 256)>
Image tile size used for multi-threaded processing.
- --no-bigtiff
Tell GDAL to not create BigTiff files.
- --tif-compress <None|LZW|Deflate|Packbits (default: LZW)>
TIFF compression method.
- --cog
Write a cloud-optimized GeoTIFF (COG). See Cloud-Optimized GeoTIFF.
- -v, --version
Display the version of software.
- -h, --help
Display this help message.